Viewer for Execution Details (VED) - Tabs
Viewer for Execution Details (VED) - Tabs
This section contains a guide on the Viewer for Execution Details (VED) and its tabs.
Viewer for Execution Details (VED) - Events Tab
Viewer for Execution Details (VED) - Events Tab
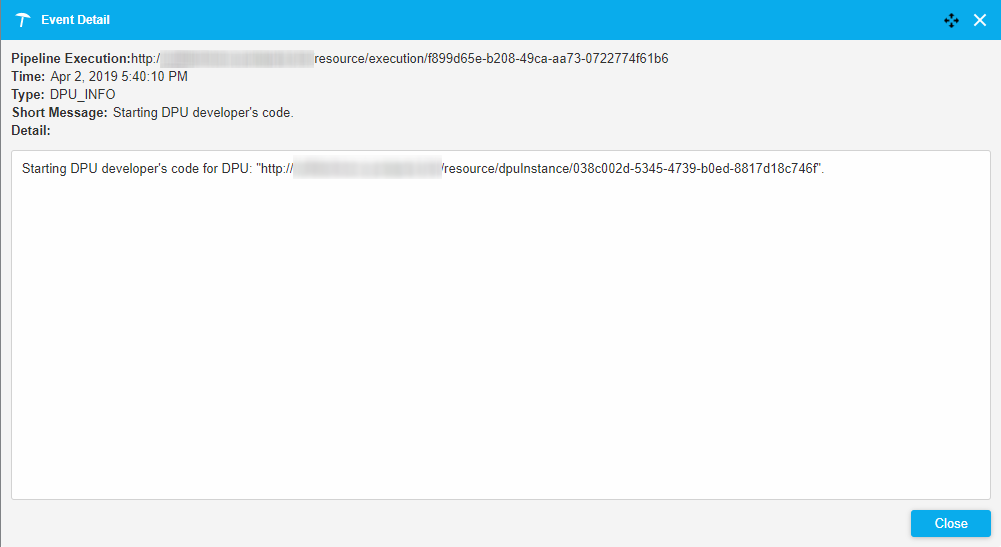
The Events tab consists of the following columns:
Type: type of an event.
Date: date when an event was started.
DPU Instance: DPU on which the action is performed.
Short Message: description of an event.
The page of latest events is displayed by default:
You can open a record detail by double clicking the respective row in the table:
Viewer for Execution Details (VED) - Log Tab
Viewer for Execution Details (VED) - Log Tab
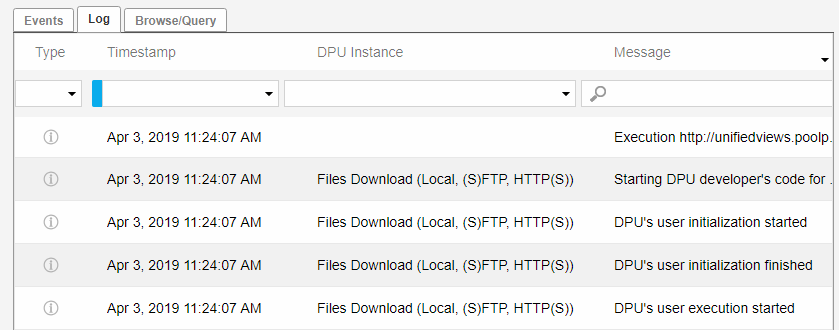
The Log tab consist of the columns: Type, Timestamp, DPU Instance, and Message.
The table can be filtered by these parameters. The page with the latest logs is displayed by default.
 |
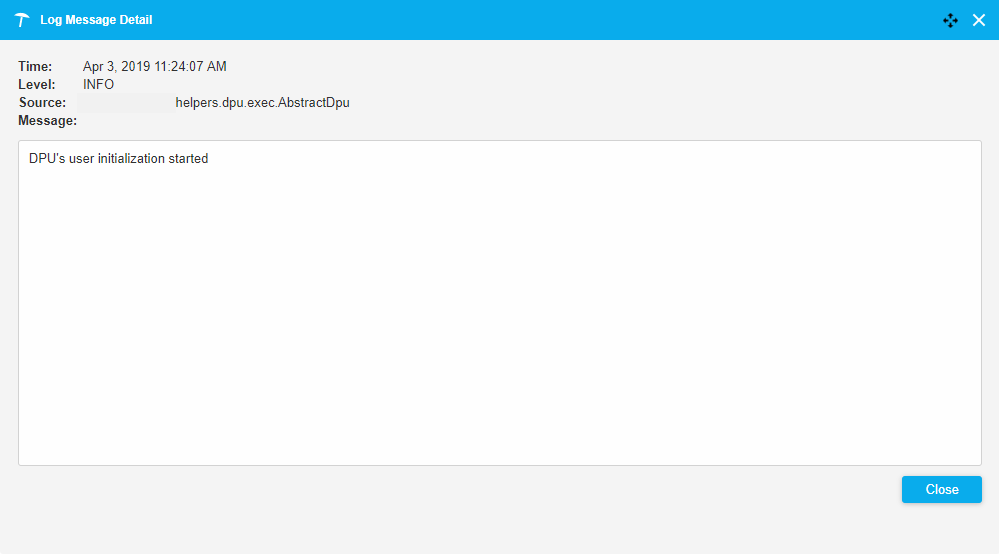
Double click on the row in the Log table to display the Log Message Detail dialogue.
The dialogue contains: Time, Level, Source and Message fields with information.
Use the black Cross icon in the top right-hand corner to toggle the Log Message Details dialogue to either have it fill the browser window or stay in front.
User can download logs in plain text format on the Options tab.
Viewer for Execution Details (VED) - Browse/Query Tab
Viewer for Execution Details (VED) - Browse/Query Tab
The Browse/Query tab is enabled if the pipeline is running in debug mode only. In all other cases this tab is disabled.
Select an item in the drop down Select DPU, to enable all other components of the tab.
The Select Data Unit drop down displays the first input data unit per default.
If there are no input data units, then the first output data unit is shown.
You can select the Input/Output check boxes. Based on that, the selection of data units is adjusted and again the first data unit is selected.
You can change the value of the Select Data Unit drop down.
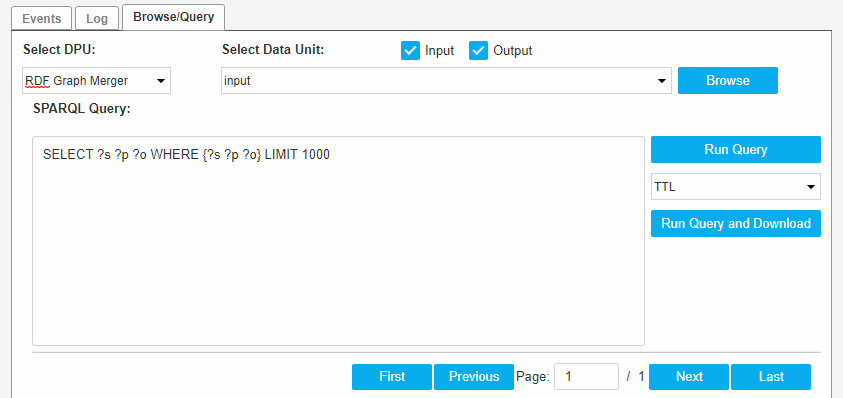 |
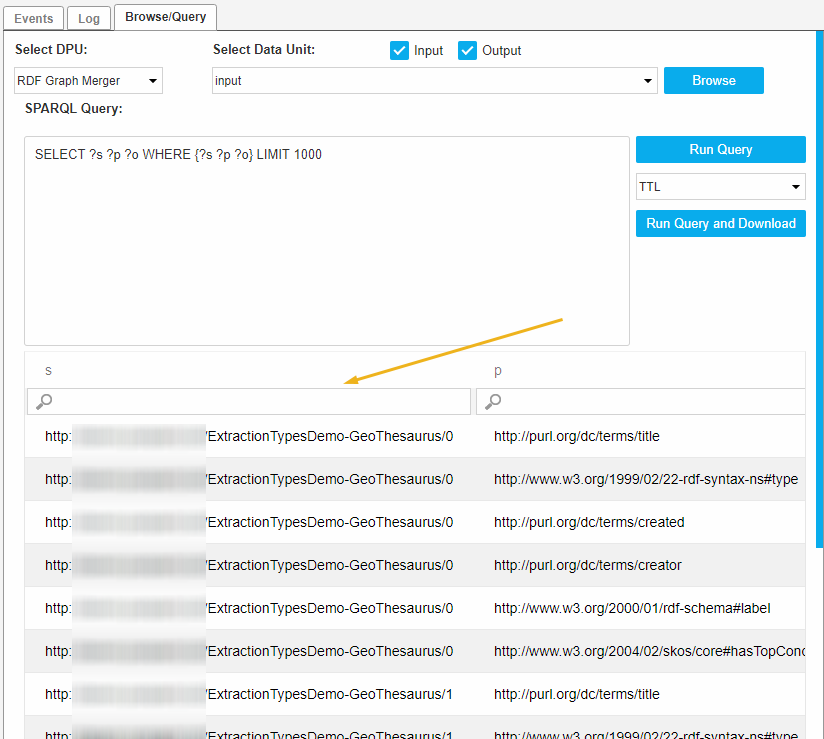
When the Select Data Unit is filled, you can show the data by clicking Browse, which displays all triples in the data unit .
This is internally the same as running construct {?s ?p ?o} where {?s ?p ?o}.
When clicking on the Browse button, the query is prefilled with the default construct query.
If the user changes Select DPU to be browsed, the available data units are refreshed. Similarly if the user changes the Input/Output selection check boxes, data units are refreshed. But the view of the data is refreshed only when the user clicks on the Browse again.
You can define your own queries and run them.
Enter your query into the SPARQL Query text area and click Run Query.
Note
If you click Run Query, you must provide the query string, otherwise a warning is displayed.
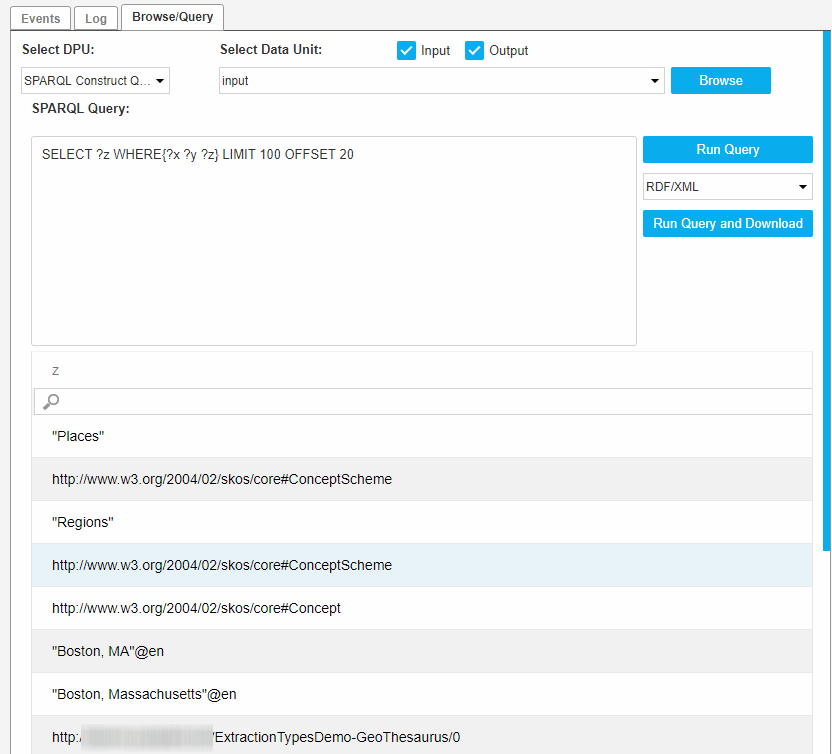
The result of the query will be shown in the table below. Queries are divided into CONSTRUCT and SELECT queries.
SPARQL Query: SELECT ?z WHERE{?x ?y ?z} LIMIT 100 OFFSET 20
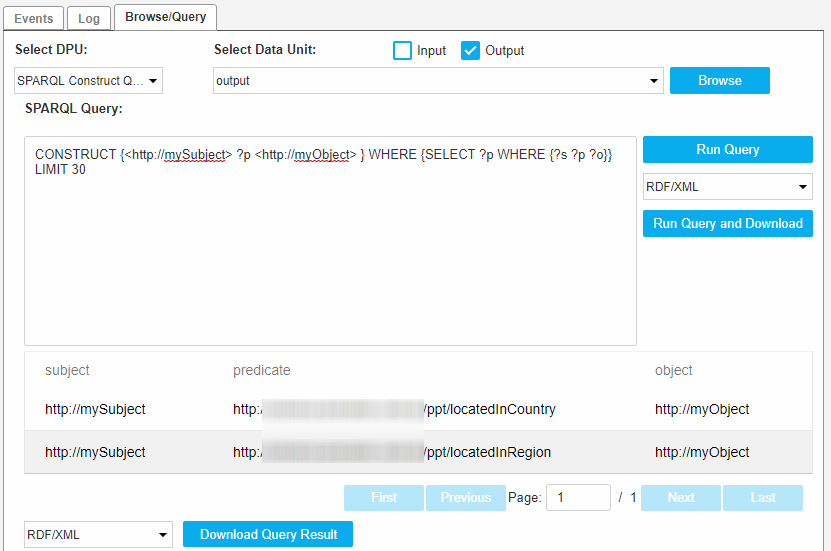
SPARQL Query: CONSTRUCT {<http://mySubject> ?p <http://myObject> } WHERE {SELECT ?p WHERE {?s ?p ?o}} LIMIT 30
If you change the Selected DPU to be browsed, available data units are refreshed.
Similarly, if you change the Input/Output selection check boxes, data units are refreshed.
On the other hand, the result of the query is refreshed only as a result of clicking Run Query.
You can download the results of the running query. Click Download Query Result beneath the table showing the result of a running query.
After that the data will be downloaded in the selected format to the destination you choose.
Download formats are different for two types of queries:
Construct query: formats :RDF/XML, TTL, N3, N-TRIPLES, TRIX and TriG.
Select query: formats are:
XML
CSV
JSON
TSV
You can click the Run Query and Download button. In this case you have to provide the query string.
Otherwise it throws a warning. The data will be downloaded in the selected format to the destination you choose. No data will be shown in the table.